Data Visualization
Visualizing The Past
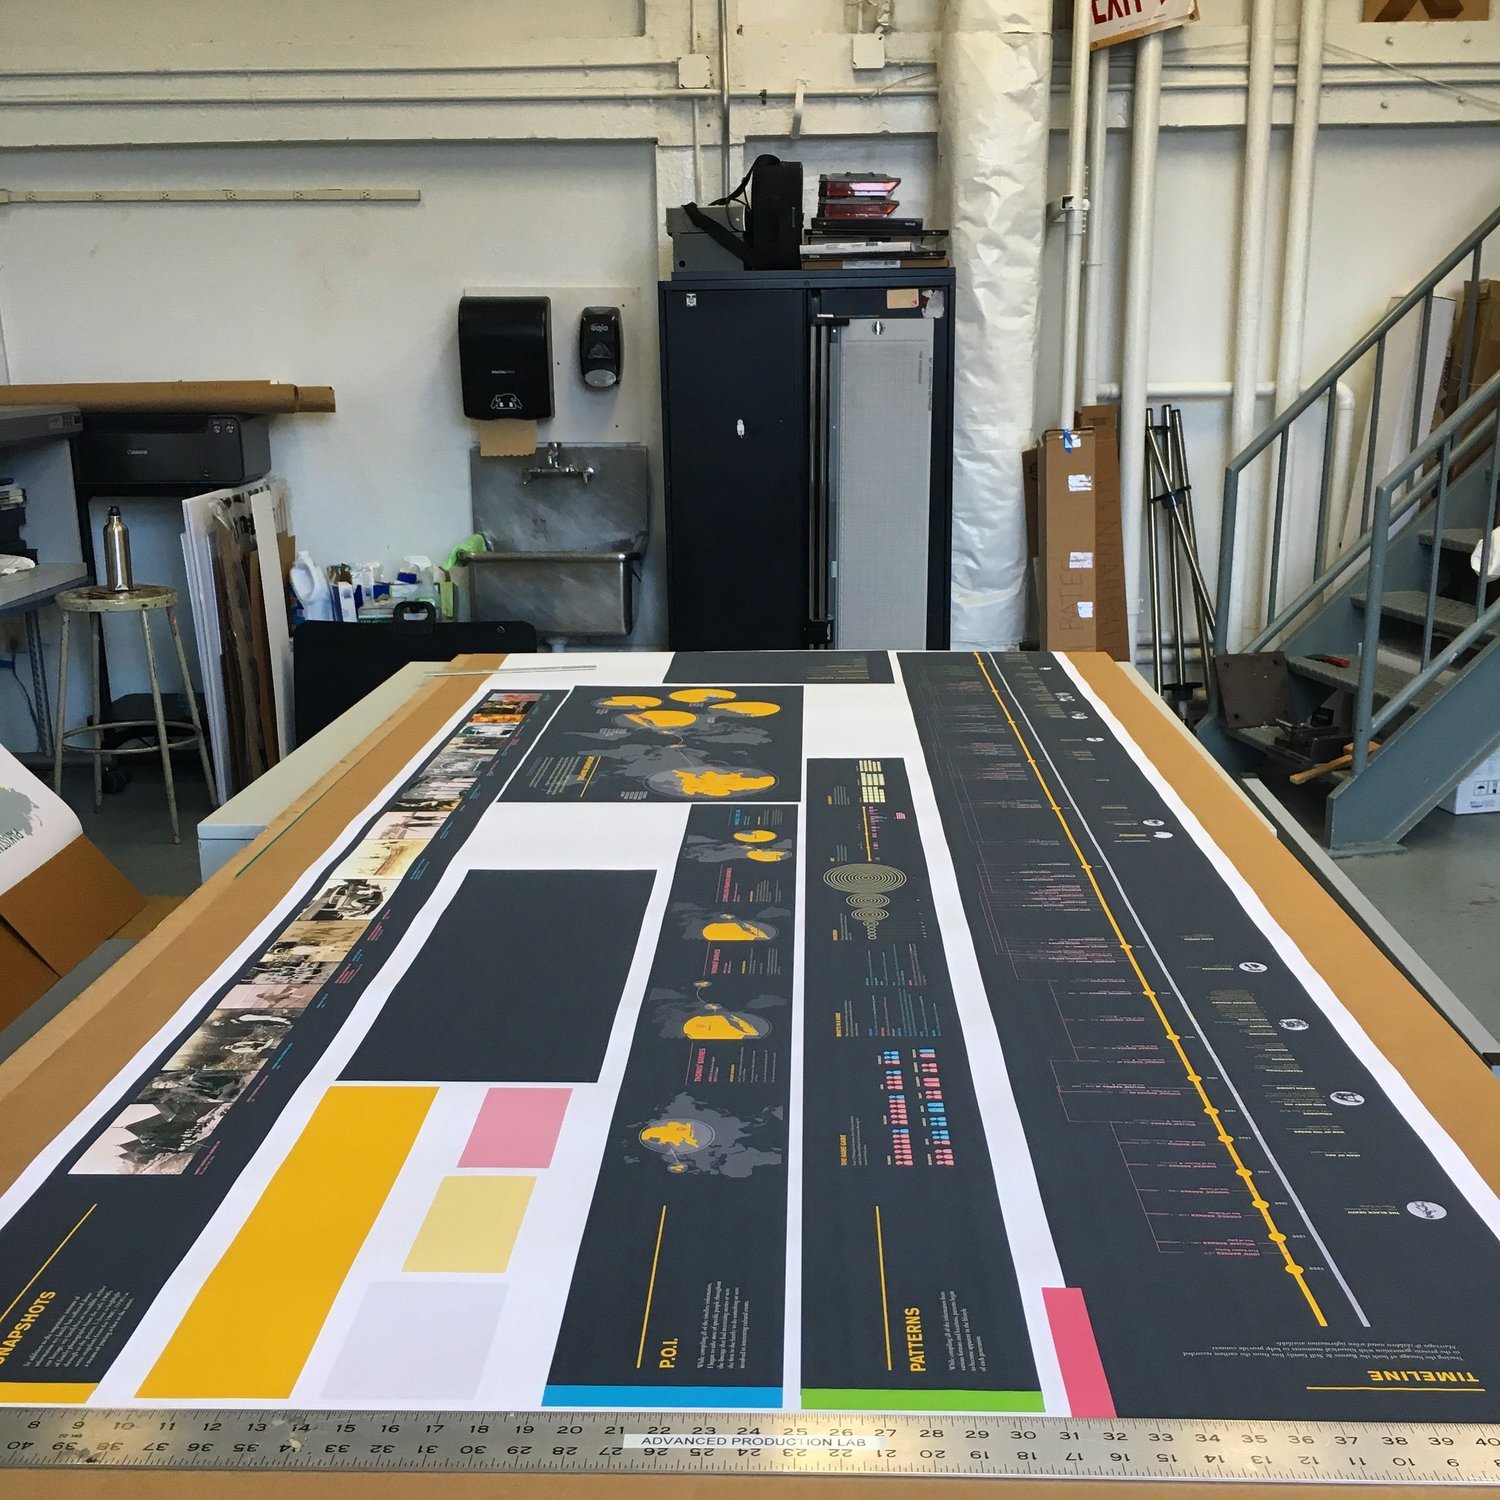
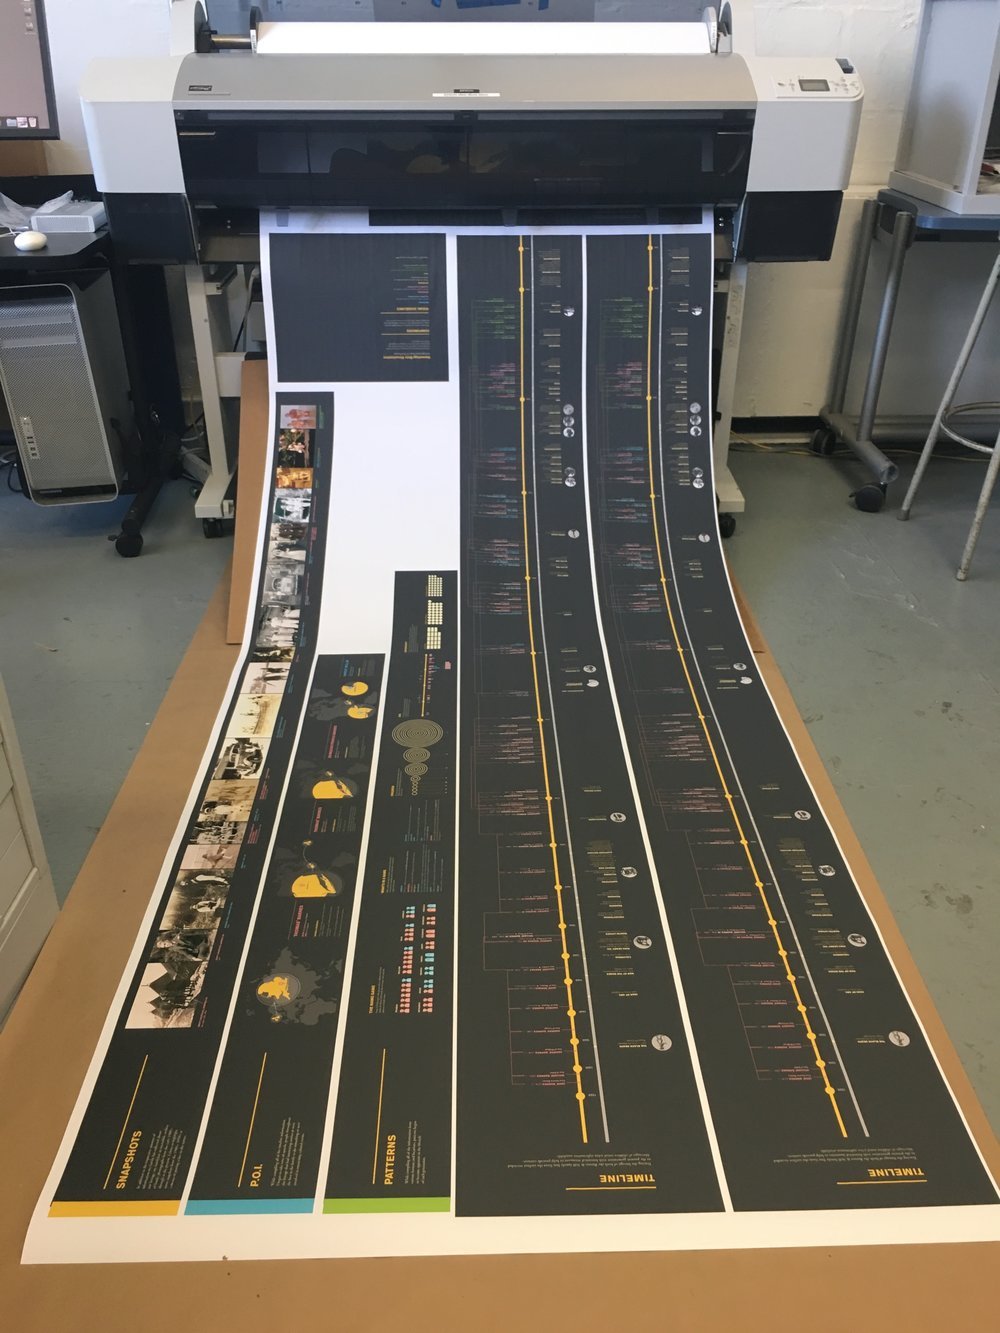
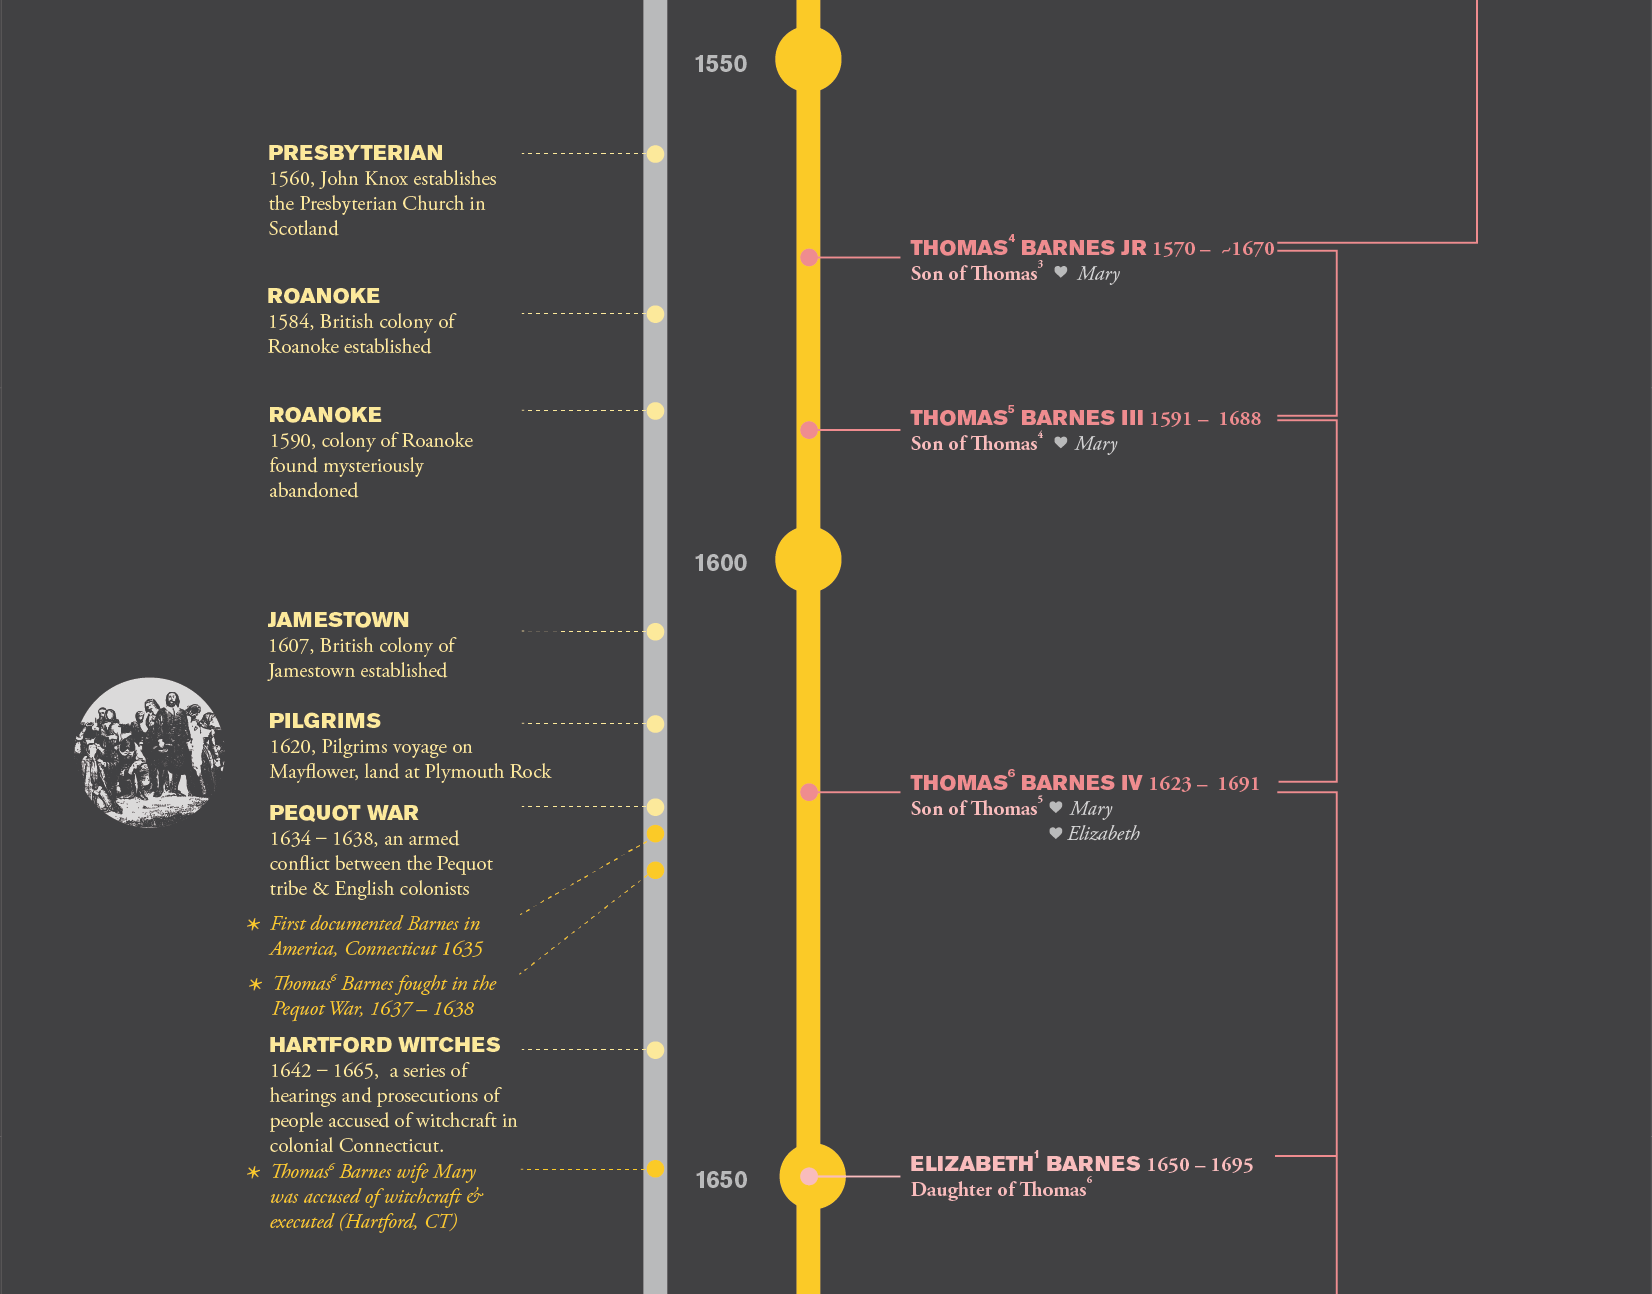
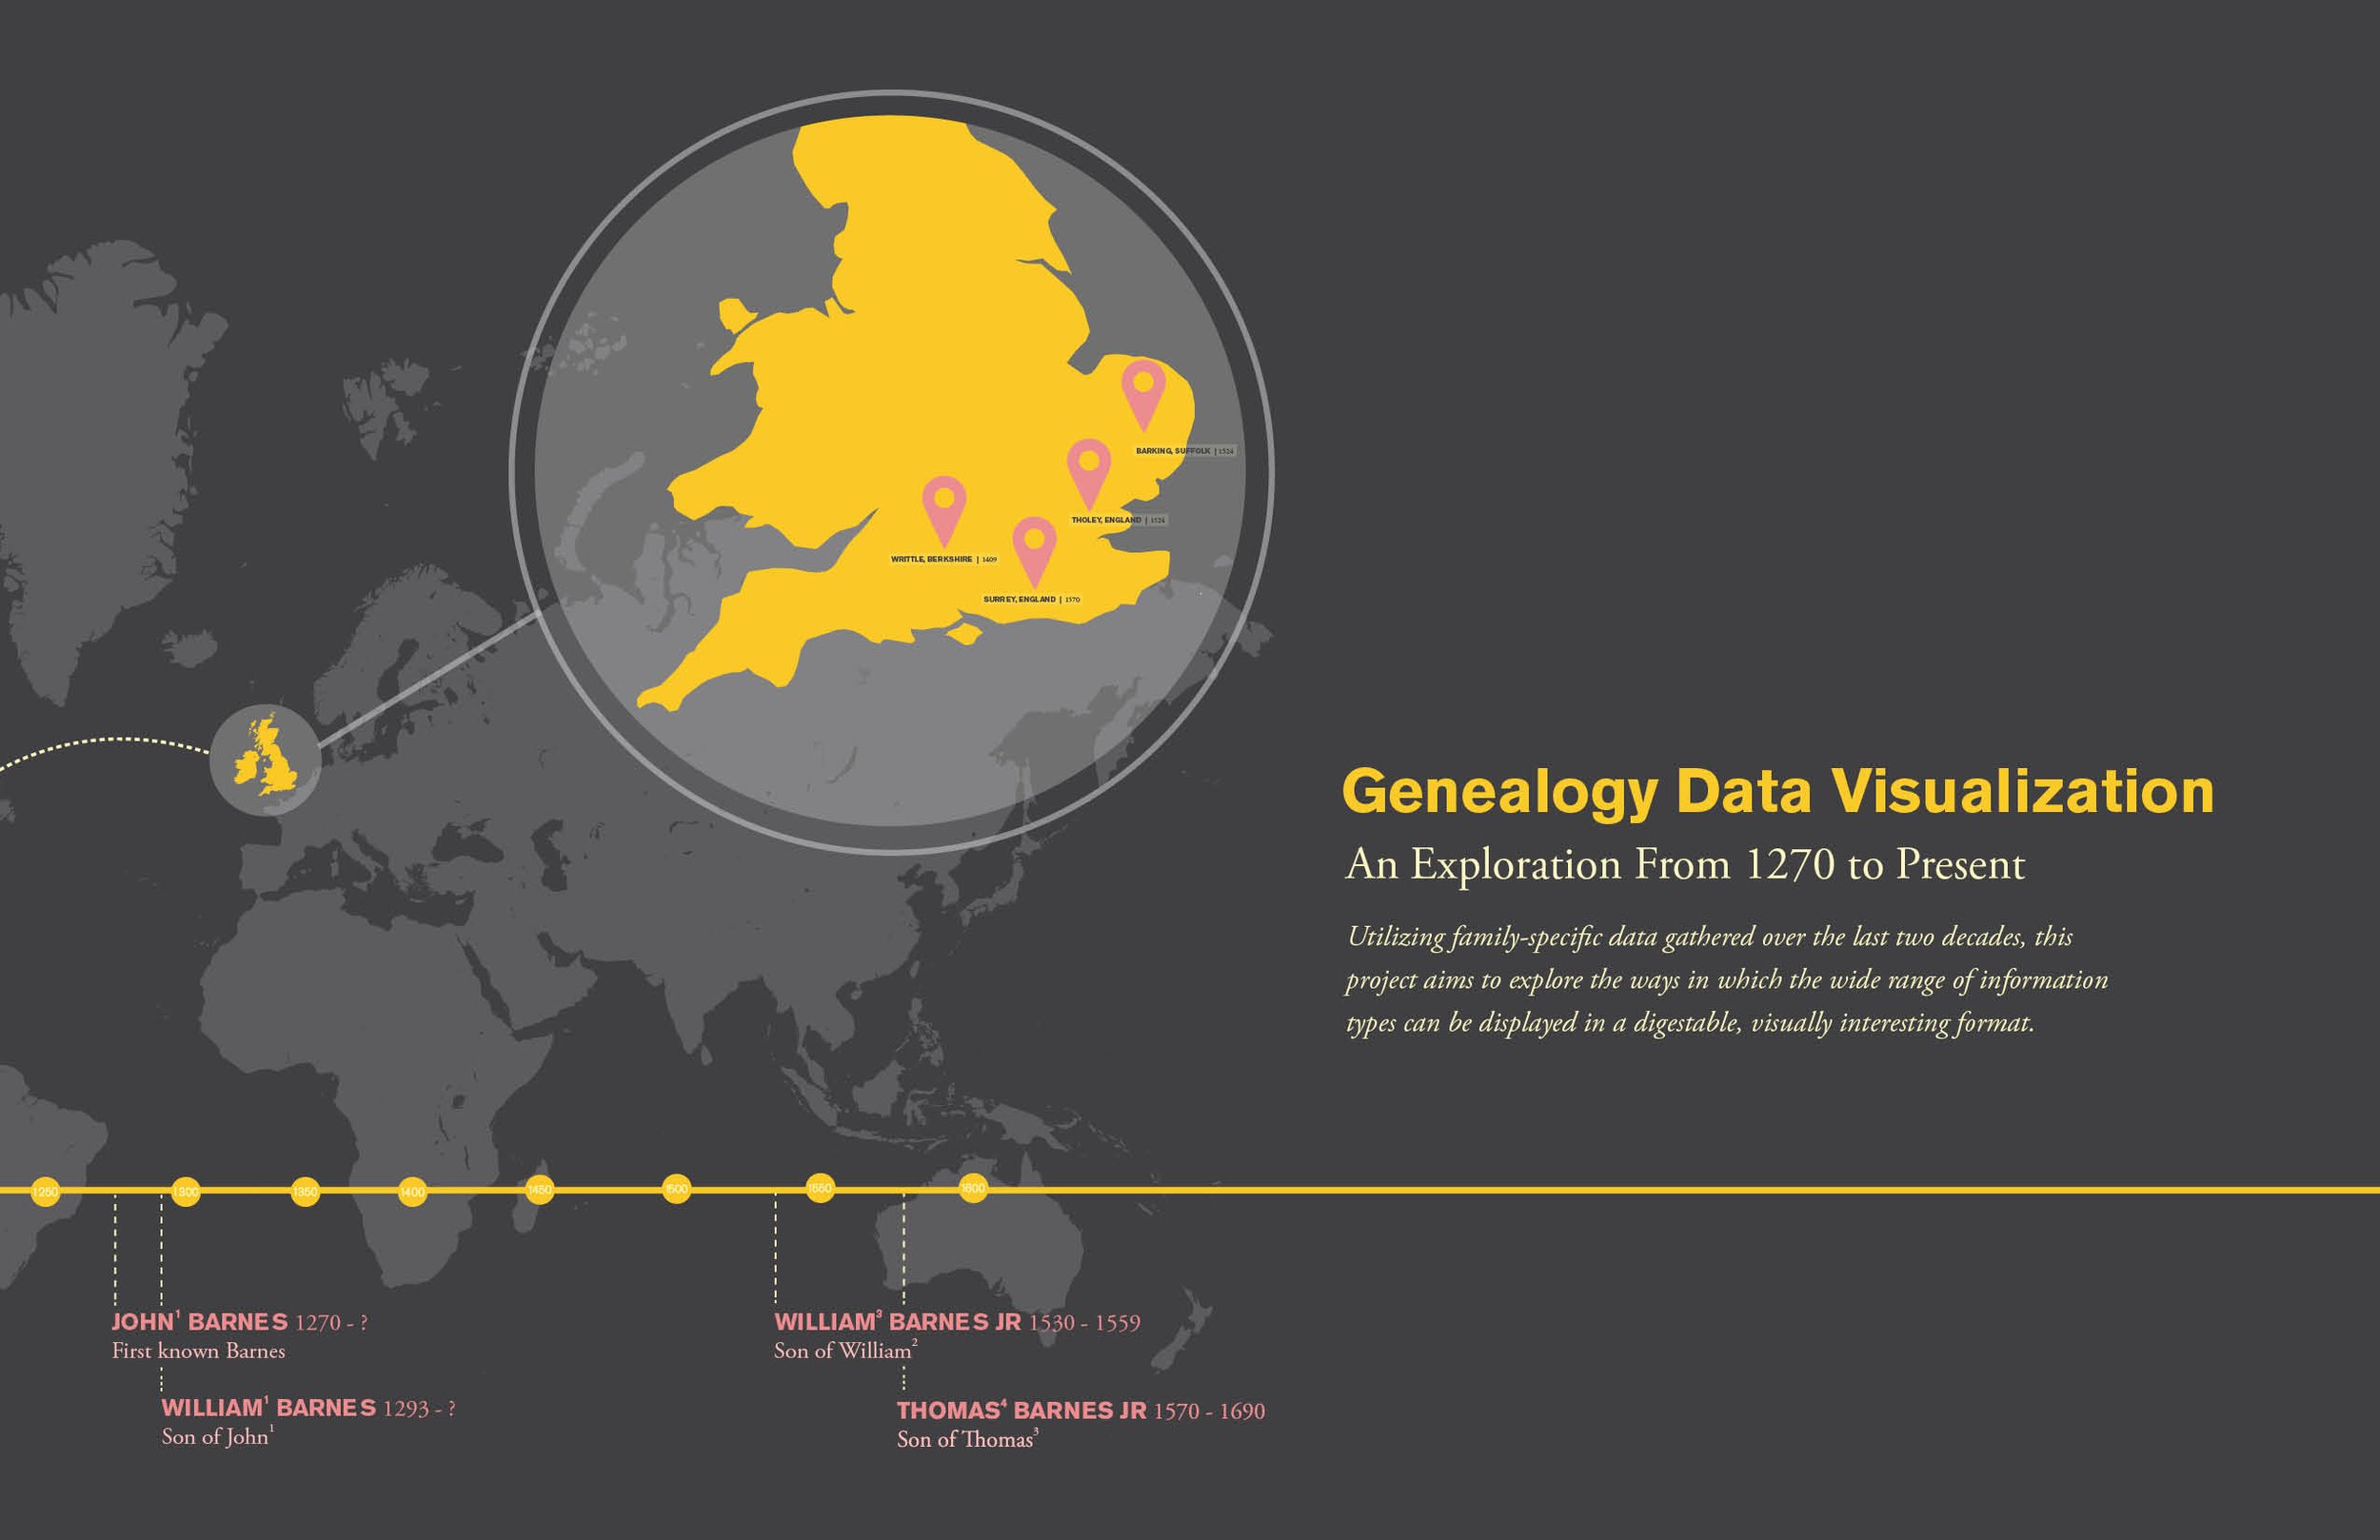
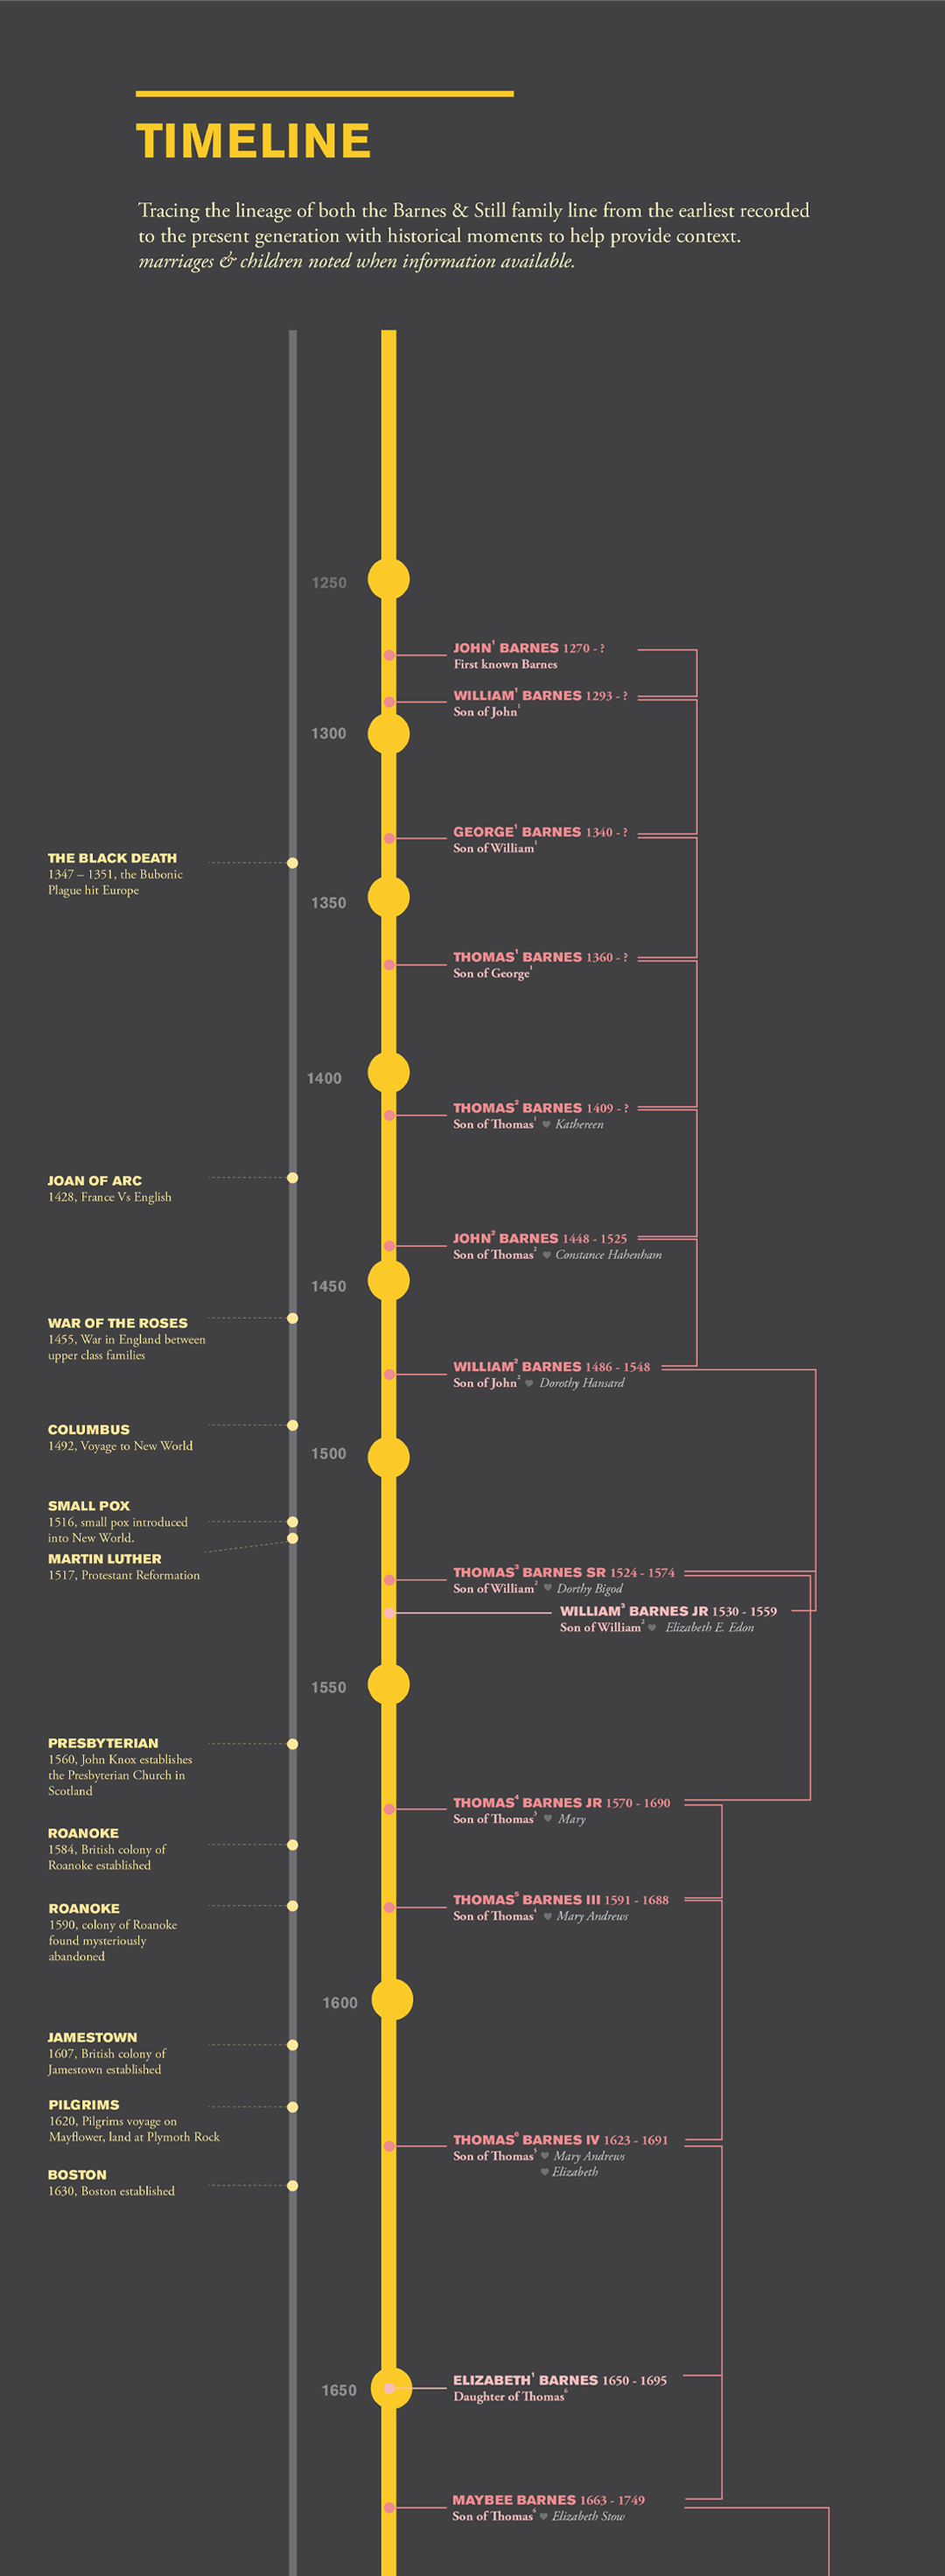
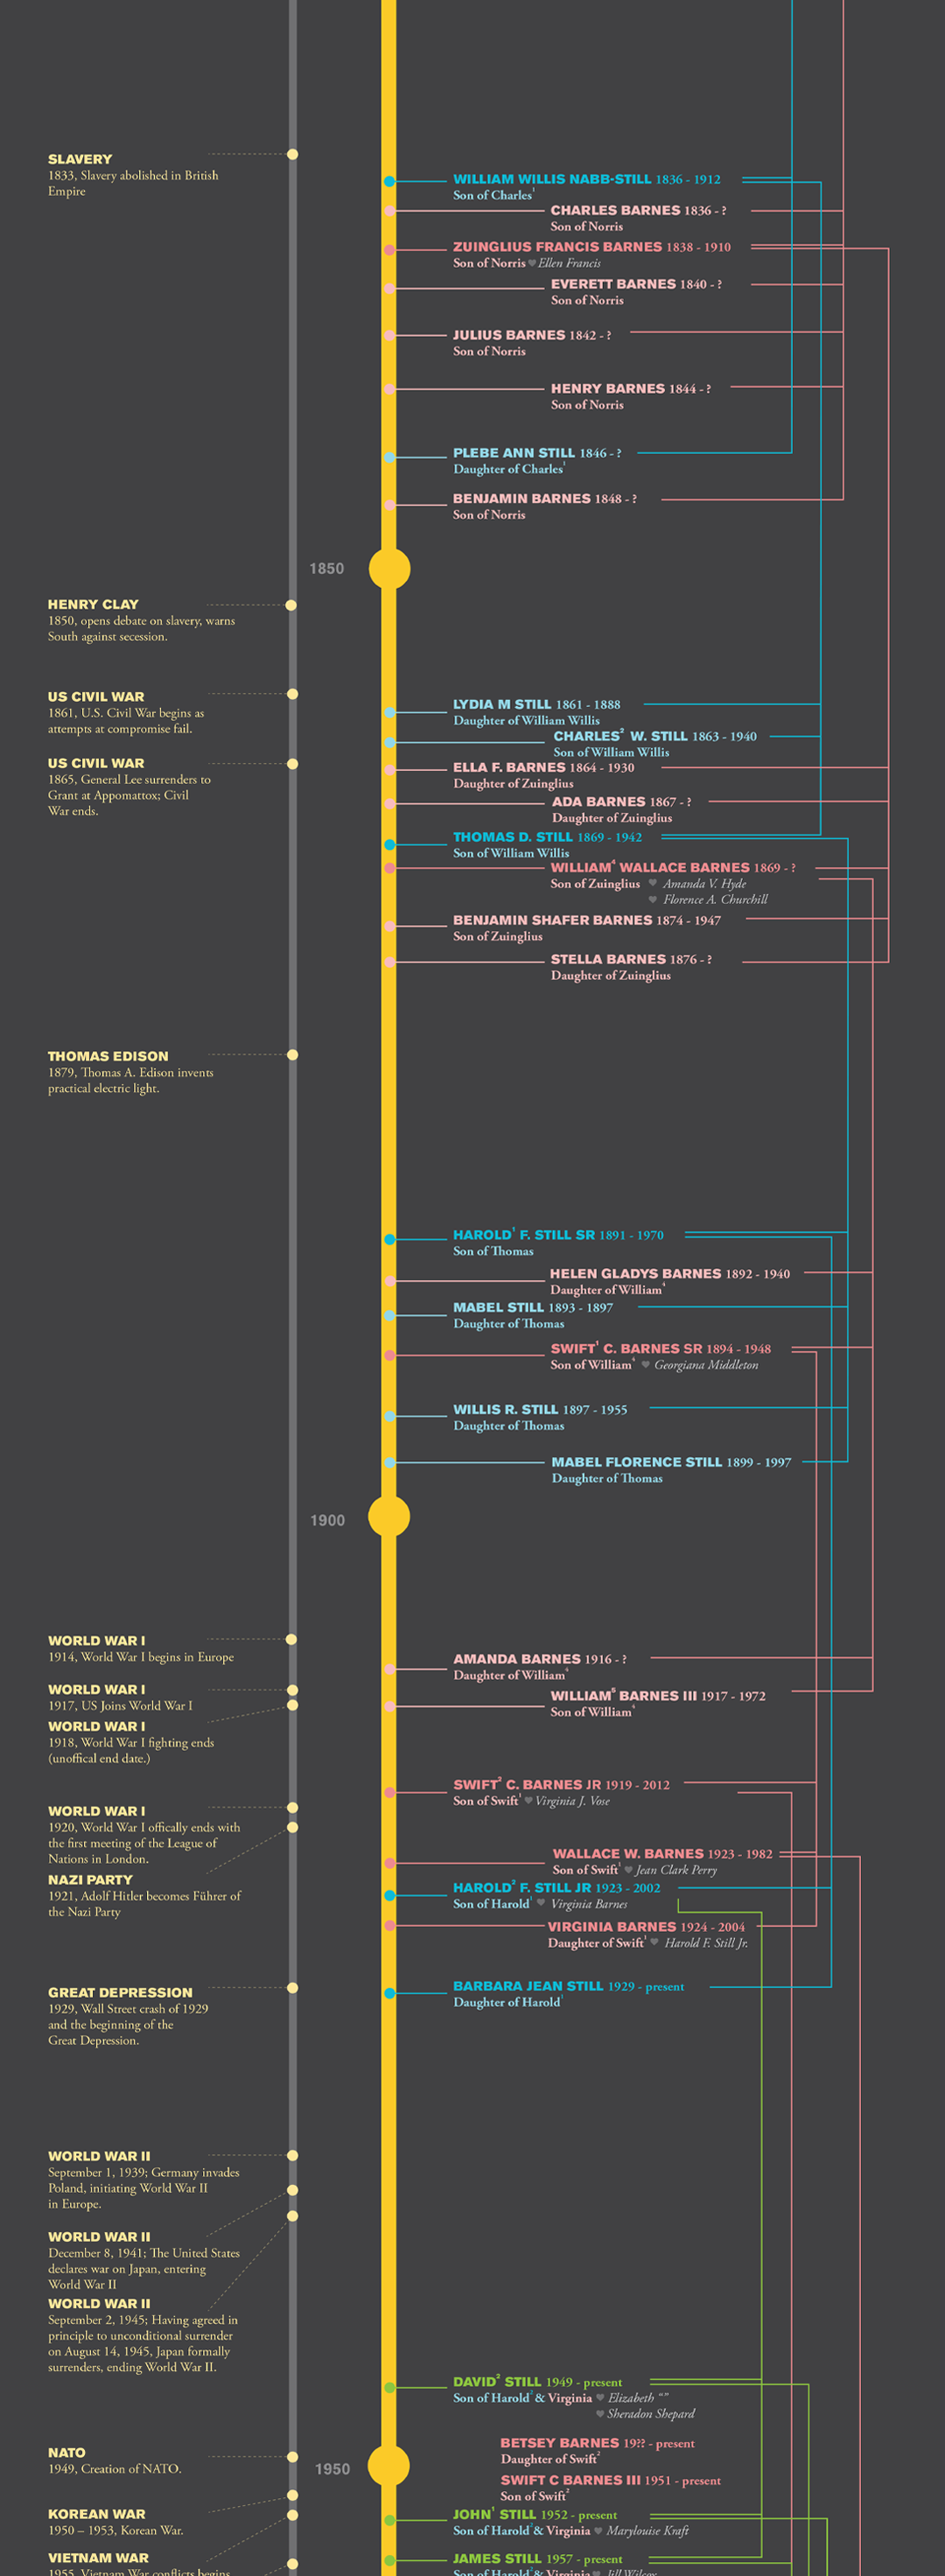
For my senior capstone project at Northeastern, I utilized genealogy data gathered by my father and great uncle to trace my father's paternal and maternal lines from the present back to the 1200's. The project consisted of multiple components: a timeline that traces lineage parallel to historical context, a map showing movement over the centuries, a series of infographics based on patterns found within the information, personal bios of select people, and a collection of photographs dating from the earliest photograph found. It existed in two ways: as individual components that fold by a grid and fit into a hand-made portfolio and as two large prints for ease of viewing in a gallery setting. The hero component of the piece and the biggest piece by far, the timeline, is over 9 feet long when unfolded.
Genealogy Data Visualization was on display at Gallery 360 in Boston from May to August 2016.
Role + Responsibilities
Design, Printing, Book Binding and Data Visualization
